An NBER Paper Prices Treasury Safety at 187 Basis Points, Up From 80
The Treasury is preparing to deploy up to $950 billion in cash to fund bond buybacks, but the real constraint isn't cash—it is the rising marginal cost of keeping public debt safe.
On September 9 the Treasury runs the first operation under a bond buyback program it doubled in size this August, one that two senior officials say could draw on a $950 billion cash reserve, though they would not say how much, if any. The same week, two independent pieces of research price the thing that is actually running short. It is not demand for Treasurys. It is the capacity to keep them safe.
The Twist, and what it buys
Two senior Treasury officials, speaking to CNBC, say the department could tap its General Account, currently about $950 billion, to help fund the buyback program it announced in August. That is well above the roughly $550 billion to $600 billion the Biden administration once set as its target for the account, which functions as the government’s checking balance at the Federal Reserve. Treasury Secretary Scott Bessent has called the operation a Treasury Twist: the government buys long-term debt and, most market participants assume, pays for it by issuing more short-term bills. The first operation under the enlarged program is scheduled for September 9.
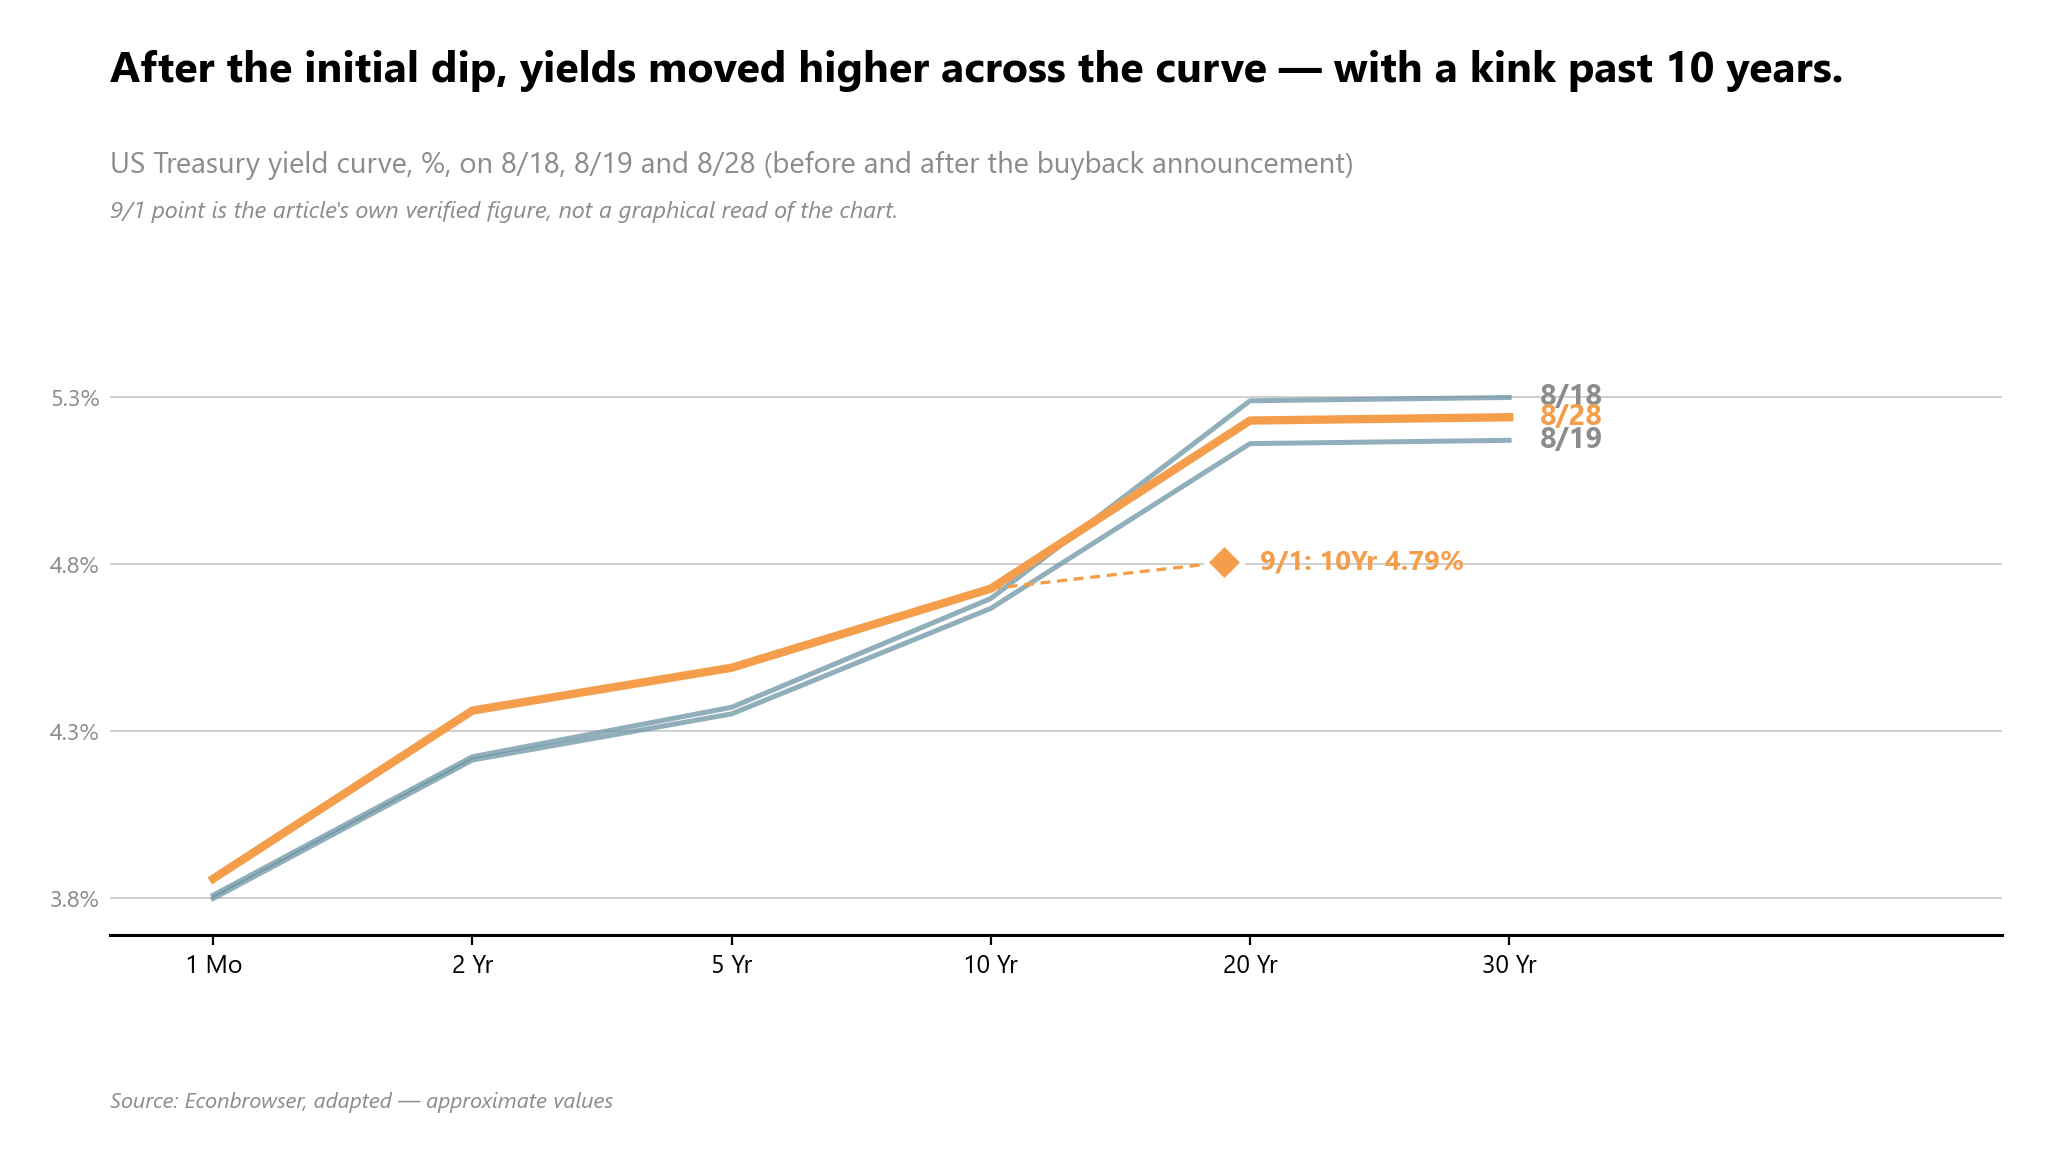
The buyback itself is not new. Treasury doubled the minimum size of its buybacks on off-the-run long securities from $2 billion to at least $4 billion per issue when it announced the program on August 19, and in the weeks that followed, the 30-year yield peaked at 5.27 percent and the 10-year at 4.73 percent.
What has changed since is that the corrective the buyback was designed to deliver has not shown up. Econbrowser tracked the yield curve on August 18, August 19 and August 28 and found that after an initial dip, almost the entire curve moved higher, with a kink visible in the plotted curve between the 10-year point and the 20- and 30-year points. By September 1, Econbrowser had the 10-year at 4.79 percent, not merely back where it started before the buyback but past it.
The buyback treats the constraint as a cash-flow problem: enough money in the right place, deployed at the right moment, moves the price. What follows is an argument that the actual constraint sits somewhere the Treasury’s checking account cannot reach.
The price of making debt safe
A Treasury bond’s safety is produced, using rollover support, market-making, and balance-sheet capacity, resources that are themselves limited and that get more expensive to supply as the stock of debt they have to absorb keeps growing. That is the mechanism at the center of a new NBER working paper by Ricardo Caballero, “The Safe-Debt Laffer Curve,” which models how safe public debt can start dragging on demand well before the government itself becomes insolvent.
Caballero’s paper reports that the marginal cost of producing safe Treasury claims more than doubled over the past decade, from about 80 basis points in the first quarter of 2015 to about 187 basis points in the first quarter of 2026. Weighed against a stated 330-basis-point benchmark for the rate-equivalent wealth benefit of holding a safe asset, a number the paper states rather than derives in the retrieved abstract, the resulting safe-debt margin fell from about 250 basis points to about 143. At the pace of borrowing the Congressional Budget Office projects for 2026, Caballero’s paper reports that remaining margin is eroding by roughly 18 basis points a year, with the erosion itself accelerating as debt grows relative to the financial system’s capacity to absorb it.
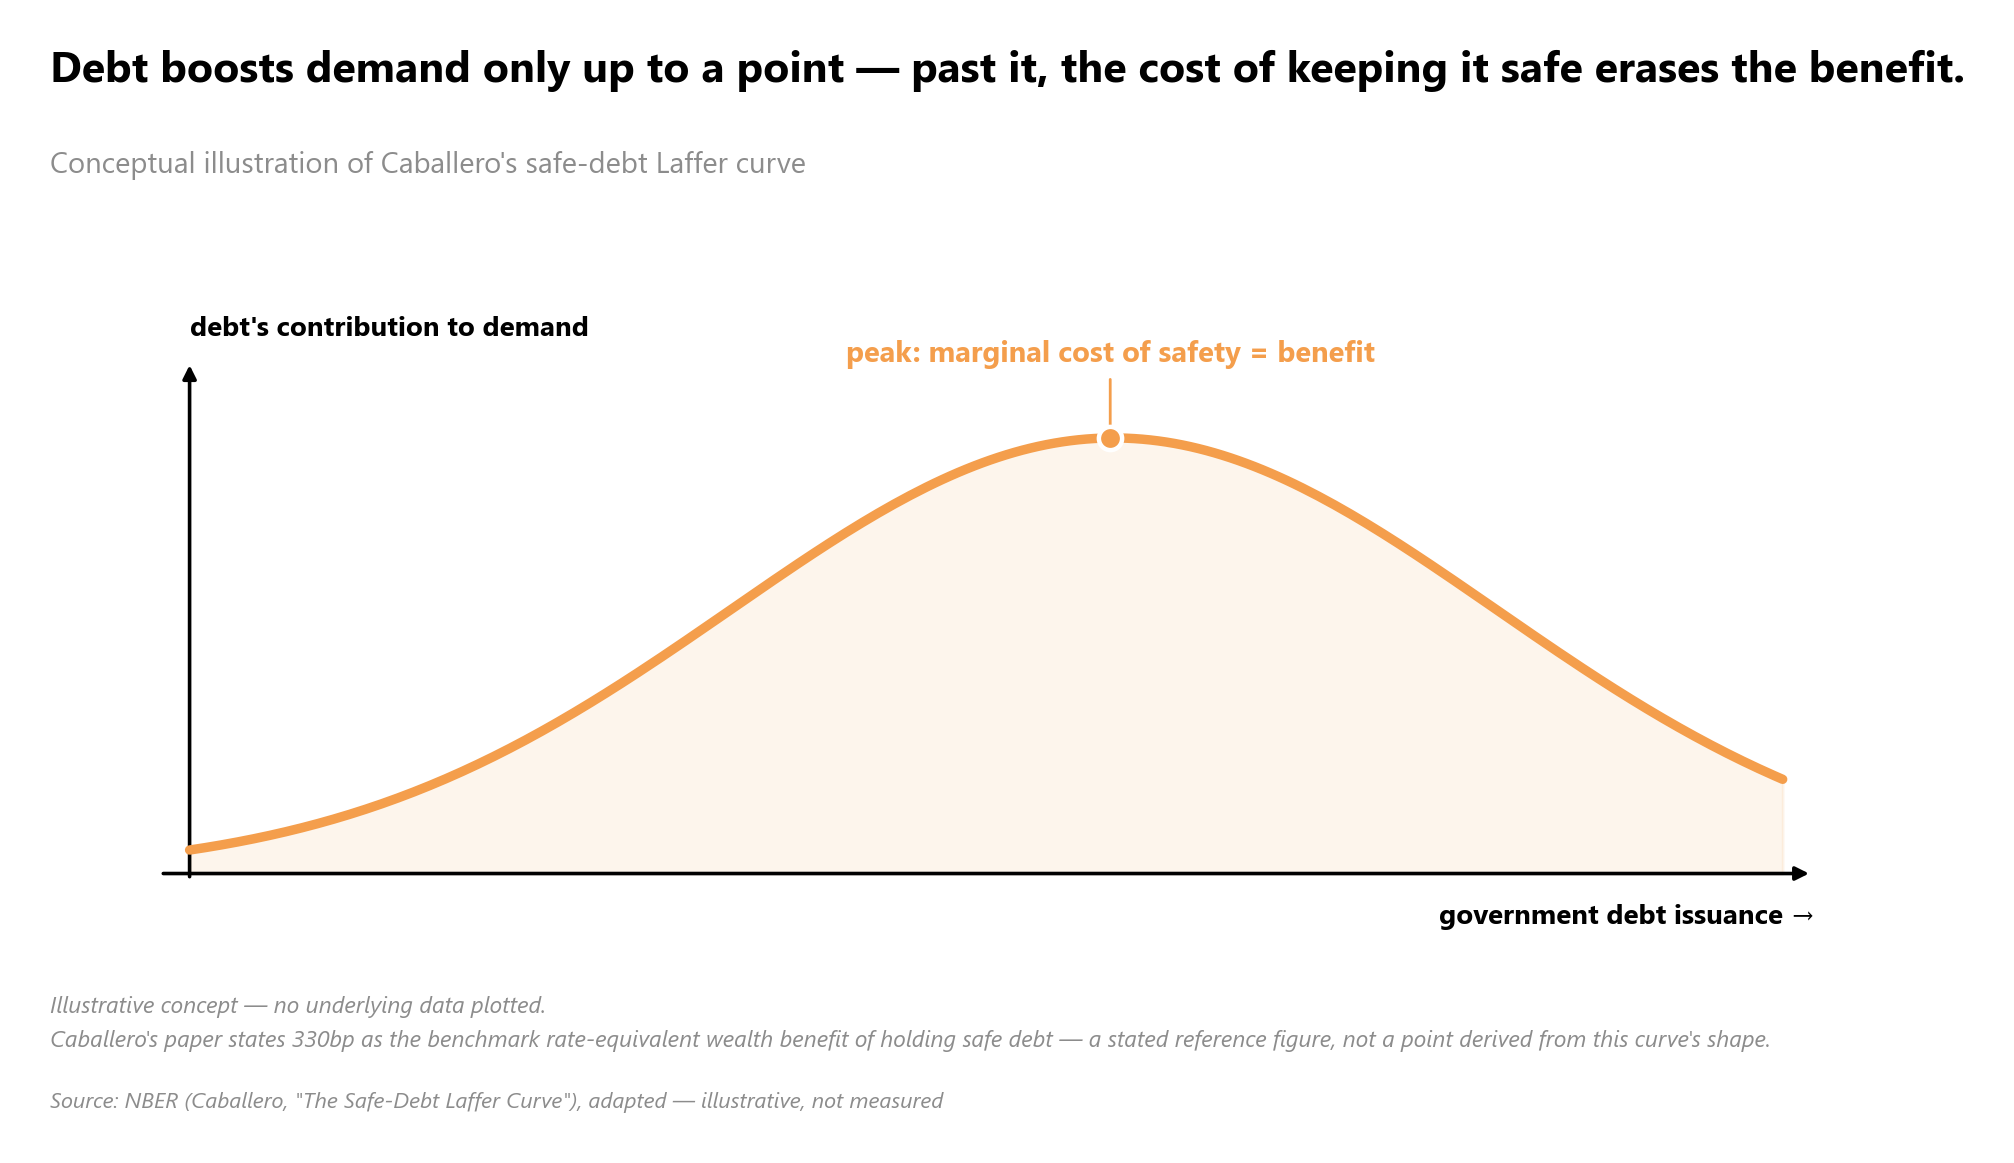
The argument holds whether or not the 330-basis-point benchmark is exactly right, because what carries it is the rising marginal cost, which the market has been pricing for a decade before anyone attached a number to the benefit side.
Who’s left holding the paper
Hanno Lustig, in a paper for the Aspen Economic Strategy Group, traces the same story through who actually buys the debt. Up to roughly 2020, US Treasury bonds and stocks moved in opposite directions, the classic flight-to-safety pattern that shows up when investors treat Treasurys as insurance against everything else falling. Since then, the correlation has flipped positive, meaning Treasurys now tend to rise and fall alongside the risk assets they were once supposed to hedge against.
The safety premium is fading elsewhere too. The Wall Street Journal reported last year that some large US companies, including Microsoft and Johnson & Johnson, were able to borrow long-term at lower rates than the US government itself, a reversal of the pattern that should hold if Treasurys are genuinely the safer asset. Lustig also points to the reserve managers who once anchored demand: foreign central banks used to allocate more than 70 percent of allocated world foreign-exchange reserves to dollar assets, but at longer maturities, Lustig writes, global investors now prefer the safety of foreign G10 government bonds instead.
Lustig’s framing of who is left is direct. The marginal foreign holder of US Treasurys, he writes, is no longer a central-bank reserve manager but “a private, yield-sensitive investor,” predominantly foreign banks, asset managers, and hedge funds. The price-insensitive official buyers have pulled back, in his account, and private investors trading on borrowed money have picked up the shortfall, demand that Lustig describes as “more elastic to yield and more fragile in stress.”
That is exactly the balance-sheet capacity Caballero counts as the scarce input. It has changed hands, from official buyers who held Treasurys regardless of price to private ones who hold them only as long as the price is right.
The stress test nobody’s failing yet
Not everyone reads the same evidence as a warning. Ben Carlson, writing at A Wealth of Common Sense, calls himself unworried about a US government debt crisis and puts the case plainly: “There is no substitute for U.S. Treasury bonds at this time.” Debt-to-GDP has climbed to its highest level since World War II, Carlson acknowledges, but he points to a household debt-service ratio that has fallen steadily since the global financial crisis as evidence the debt load is not showing up as household stress. Citing Cullen Roche, Carlson notes total US financial assets sit near $450 trillion, a scale against which the $40 trillion federal debt figure that made headlines in August looks smaller.
Carlson also cites Stanley Druckenmiller’s view that the long-term Treasury yield is “the most important price in the world” and “the only fiscal disciplinarian the U.S. has left.” The quote serves here only as a description of that disciplining function, not as a verdict on whether the buyback is working, and that function is exactly what Caballero is putting a rising price on.
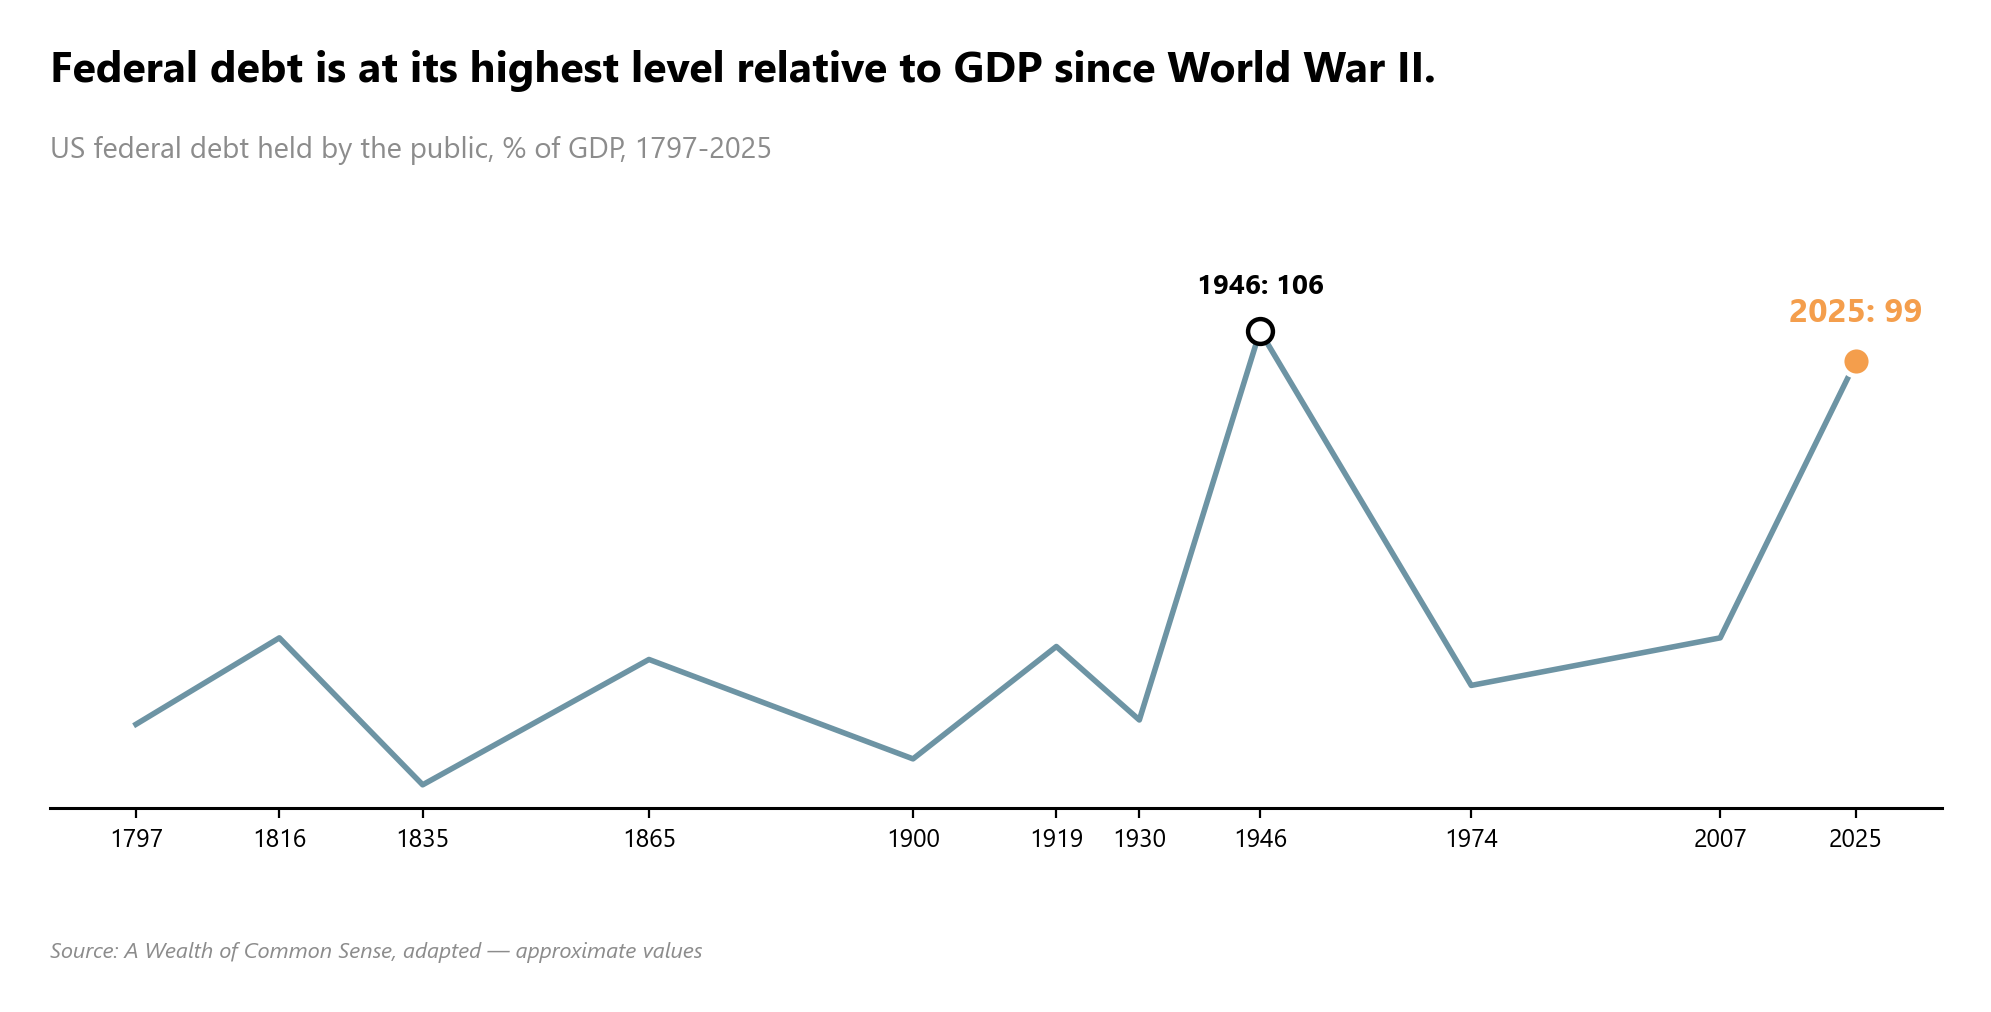
The Government Accountability Office puts a number on what fixing the trajectory would take. To hold debt held by the public at 100 percent of GDP by 2056, the GAO calculates, the government would need to raise revenue by 26 percent every year, cut program spending by 21 percent every year, or find a comparable combination of the two. No major policymaker in either party has proposed anything close to that scale.
Carlson is right that there is no substitute today. Caballero and Lustig describe something else: the cost of keeping the original safe rising steadily in the background, regardless of who turns out to be right about a crisis.
What it means
Klement on Investing, citing a Federal Reserve Board study by Bhatt and coauthors, reports that a one-percentage-point rise in the market’s expected US debt-to-GDP ratio raises the expected 10-year Treasury yield five years out by about 4 basis points, roughly split between a 2-basis-point increase in the term premium and a 2-basis-point increase in the risk-free rate. Applied across the stock of federal debt, Klement’s relay of the study translates that into roughly $14 billion in additional long-run annual interest cost, for a market expectation, not an actual increase, in the debt ratio.
September 9 is worth watching, if only because it is the first real test of whether the enlarged buyback can move a curve that has moved against it twice already. But the argument here does not hinge on that day’s yield print. Caballero’s roughly 18 basis points a year is a slow, structural erosion, unfolding over years rather than a single auction, and Lustig’s shift from official to private holders does not reverse because one auction goes well.
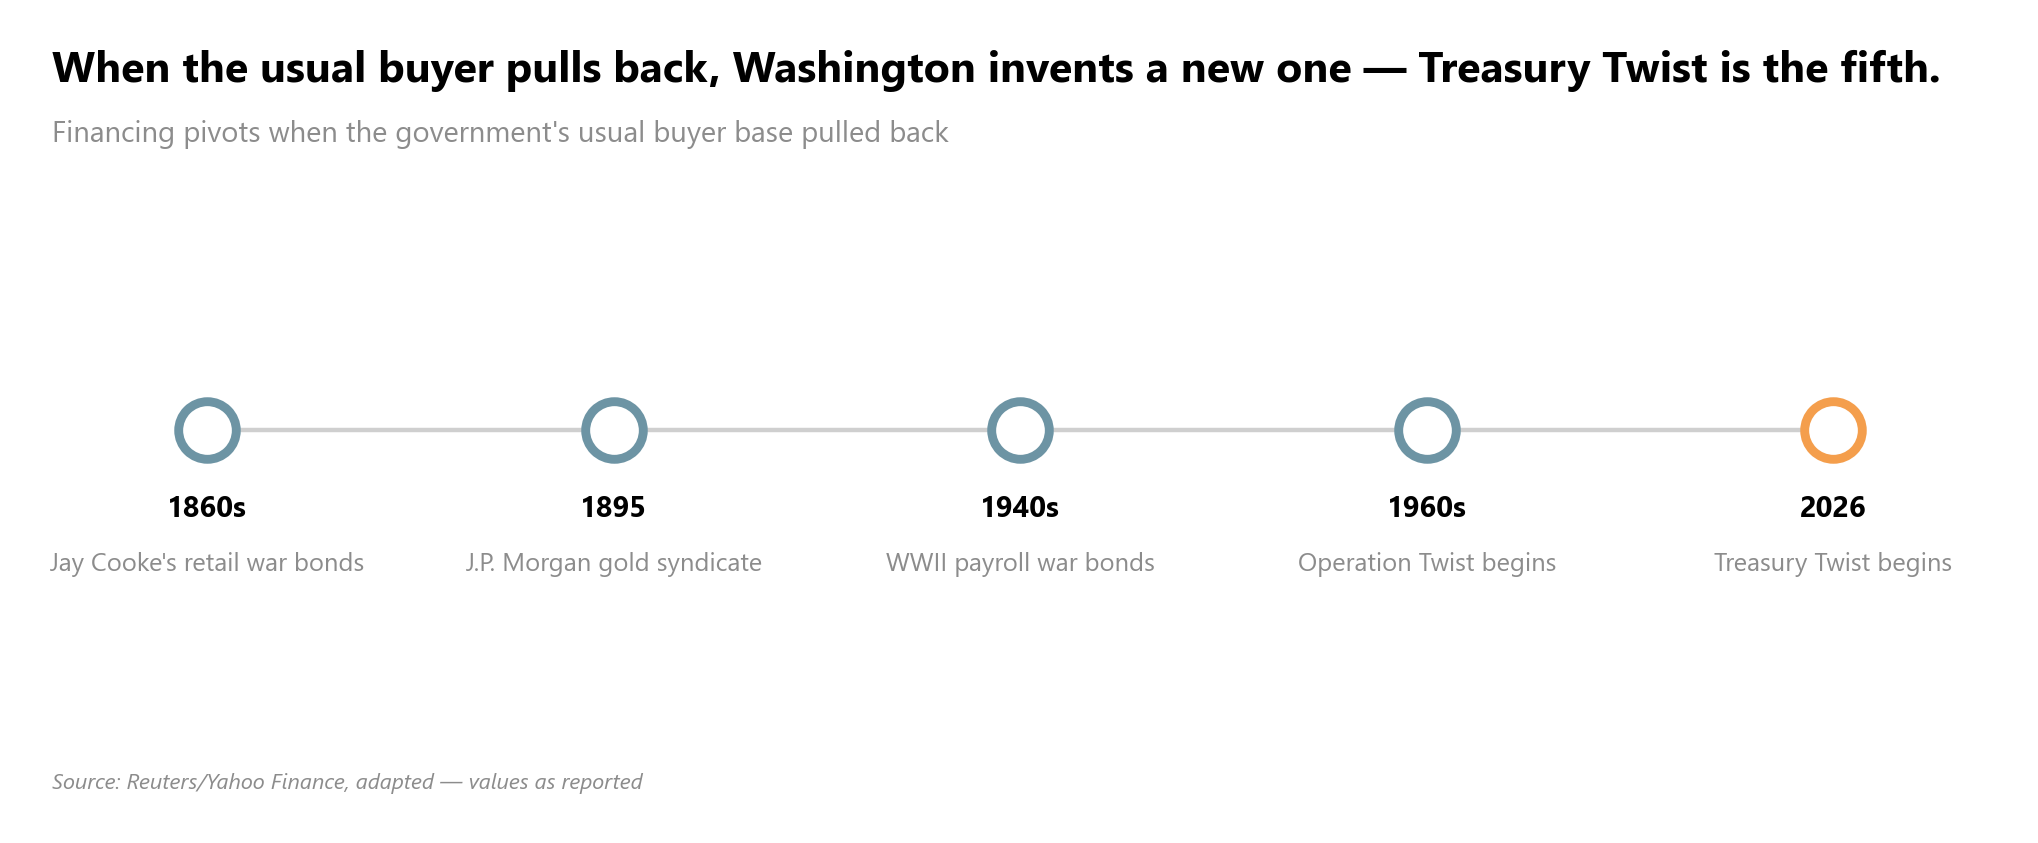
Washington has been here before, in the sense that it has repeatedly had to invent new financing tools when its usual buyers stepped back, from Civil War bonds Jay Cooke marketed nationwide through banks, sub-agents, advertising and patriotic appeals, to the 1895 gold syndicate led by J.P. Morgan and August Belmont, to the payroll war bonds of the 1940s, to the original Operation Twist of the 1960s that lends Bessent’s own name for this program its shape. Each of those was a response to a buyer base that had changed. What Caballero and Lustig describe is not a buyer base that might change. It is one that already has, and a cost of keeping the debt safe that keeps rising whether or not September 9 goes well.
Sources
- Bessent could tap near $1 trillion Treasury General Account to fund bond buybacks, sources said (CNBC)
- Yield Curve Pre- and Post-Buyback (Econbrowser)
- Ten Year at 4.79% (Econbrowser)
- The Safe-Debt Laffer Curve (NBER)
- Is US Government Debt Getting Riskier? (Conversable Economist)
- My Most Contrarian Opinion Right Now (A Wealth of Common Sense)
- GAO: One More Warning on US Federal Debt (Conversable Economist)
- We are all ‘in hock to the bond market’ (Klement on Investing)
- The history of financing America, in six crisis episodes (Yahoo Finance)