US Firms' $904 Billion Q2 Profit Masks S&P 500's 22-Year Payout Low
As the S&P 500 closed above 7,800 on October 6, Aswath Damodaran's audit of US public companies shows that an almost 36% second-quarter surge in capital expenditures has pushed the S&P 500 cash payout ratio down to 63% of earnings, its lowest level since 2004.
On Tuesday, October 6, the S&P 500 hit an intraday record of 7,844.52 and closed above 7,800 for the first time. A day earlier, the 10-year Treasury yield topped 5.3%, its highest level since 2002. Investors shrugged off higher yields because second-quarter net income across listed US firms jumped 57% year-on-year to $904 billion. Yet an October 8 audit by Aswath Damodaran shows that capital spending has pushed S&P 500 cash payouts down to 63% of earnings, a 22-year low.
Why a capex boom inflates aggregate earnings before it drains free cash flow
As CNBC Finance reported on October 6, that 7,800 record beat the August 13 intraday peak of 7,830 after crude oil climbed back above $100 a barrel in early September amid Strait of Hormuz disruptions. Stocks also defied the Federal Reserve’s mid-September rate hike, its first in over three years, and signals of further hikes. In September, as we noted in Lagarde Calls AI Financing ‘Serious Competition for Sovereign Debt’, Christine Lagarde warned that AI borrowing competes with sovereign issuers. Damodaran traces that capital surge inside US corporate filings, where accounting rules split builders from suppliers.
For AI infrastructure builders, namely hyperscalers Meta, Alphabet, Amazon, and Microsoft, capital expenditures (capex) do not immediately reduce net income. Accountants book those purchases as balance-sheet assets and expense them gradually through amortization. Longer amortization schedules at many builders further soften the near-term earnings hit. Free cash flow, calculated after capex, absorbs the cash outlay immediately.
What leaves builders’ cash accounts enters suppliers’ income statements as immediate revenue. Chipmakers Nvidia and TSMC, networking firms Broadcom, Micron, and Marvell, power generator Constellation Energy, and data center landlords Equinix and Digital Realty book those orders right away. Because suppliers like Nvidia sell chips at steep markups, those revenues flow through high net margins into net profits. Across the market, supplier profits inflate aggregate earnings while builder outlays drain free cash flow and compress shareholder cash payouts.
How a top-heavy market absorbed a 54-basis-point Treasury shock while two-thirds of listed stocks fell
That gap between paper profits and free cash flow explains how US equities weathered September’s bond sell-off. Damodaran notes that the 10-year Treasury yield jumped 54 basis points in September, from 4.75% to 5.29%, ranking in the top 10% of all 770 monthly changes between 1962 and 2026. Across all 5,376 listed US firms active entering 2026, market capitalization still grew by $2.5 trillion in September, from $75.62 trillion to $78.15 trillion. Technology generated almost $1.5 trillion of that gain, while technology, energy, and materials have carried the market in 2026. Beneath the index advance, about 50% of listed companies (50.04%) are up in 2026, and about 65% of listed US stocks fell during the third quarter.
Inside the S&P 500, the Magnificent Seven (Nvidia, Alphabet, Amazon, Apple, Meta, Microsoft, and Tesla) represent over 34% of market capitalization. Potomac Fund Management strategist Shawn Snyder told CNBC on October 6 that stocks stay resilient while profits hold up. Snyder still warned that “there are still things going on underneath the surface that may not be so calm” and that weak breadth could persist. Econbrowser reproduced a Yardeni Research and LSEG Datastream chart on October 6 putting the Magnificent Seven forward price-to-earnings ratio at 22.9, against 19.1 for S&P 500 LargeCap, 15.1 for MidCap, and 14.2 for SmallCap. As Econbrowser notes, those forward multiples rest on analysts’ “guesses.”
Rather than relying on forward multiples, Damodaran prices the S&P 500 at its September 30 close of 7,651.54 to estimate an expected equity return of 8.99% entering October 2026. Subtracting the 5.29% 10-year Treasury yield leaves an implied equity risk premium of 3.70%, or 3.92% over the 5.07% risk-free rate adjusted for the 0.22% US Aa1 default spread. An October 8 A Wealth of Common Sense analysis notes that the S&P 500 beat 5-year Treasuries in over 83% of rolling 10-year periods since the late 1920s. Across the 26 calendar years when US stocks fell (averaging minus 13.5%), bonds averaged a 4.3% gain.
Inside the second-quarter numbers: $904 billion in net income, $133.4 billion in new capex, and a 63% payout ratio
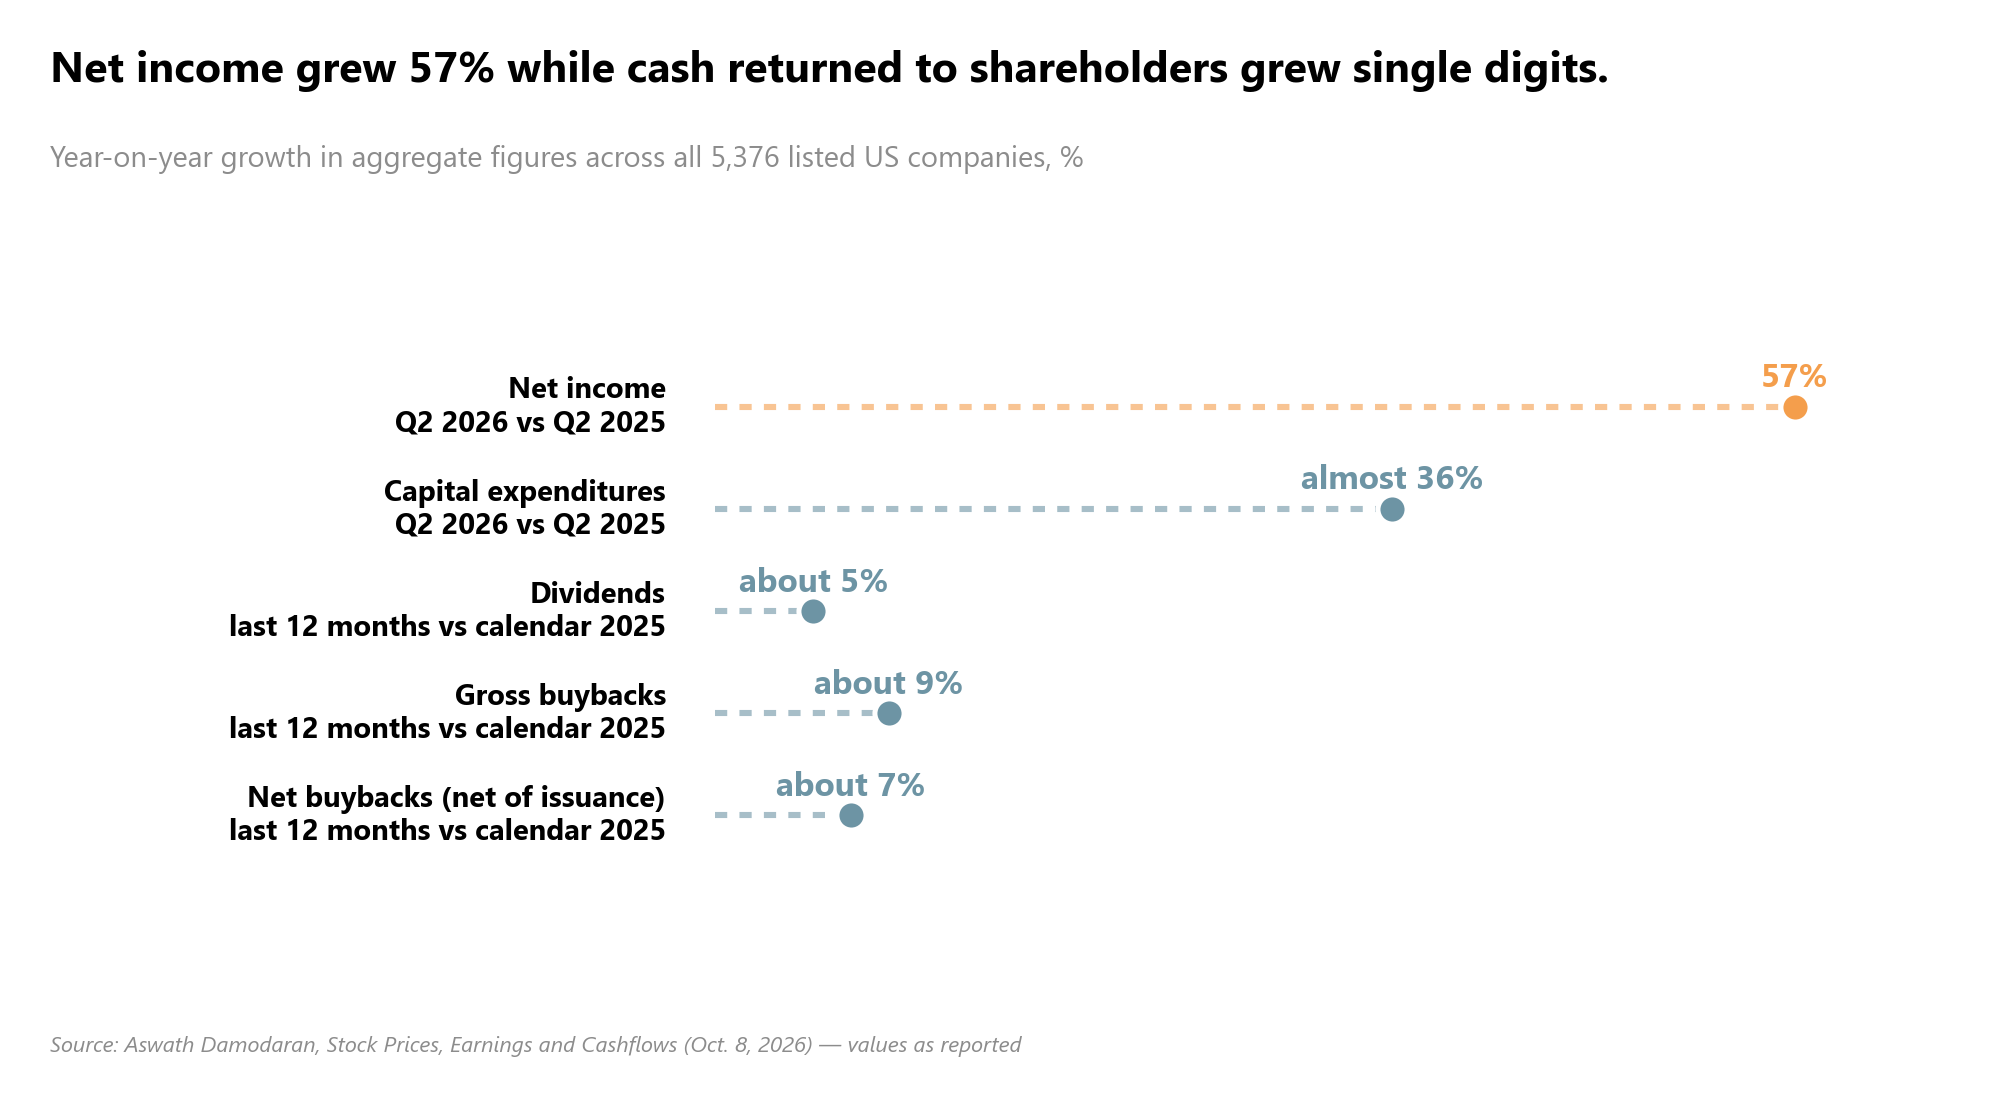
Damodaran’s tabulations across all 5,376 listed US firms show why that 3.70% equity risk premium rests on narrow cash flows. Aggregate net income across listed US companies rose 35% year-on-year in the first quarter of 2026 (from $511 billion to $692 billion) and 57% in the second quarter (from $576 billion to $904 billion). Yet over half of listed firms posted falling net income, as gains concentrated in technology, financials, and communication services while health care, utilities, and real estate lagged.
The top ten hyperscalers account for over $2 trillion of AI capex, with Amazon projecting about $200 billion in 2026 capital spending according to CNBC. Across all 5,376 US stocks, second-quarter capex rose $133.4 billion year-on-year, from $374.04 billion in 2025 to $507.40 billion in 2026. That increase of almost 36% (35.66% in Damodaran’s table) lifted twelve-month capex to $1.81 trillion versus $1.44 trillion in calendar year 2025. Second-quarter capex jumped 79.88% in technology, 62.01% in communication services, and 50.07% in consumer discretionary.
Because capital outlays partially or fully offset higher earnings across firms, free cash flow has grown much more slowly than net income. Across all listed US companies, twelve-month dividends still rose about $43.3 billion (about 5%) over calendar year 2025. Gross buybacks rose about $106.7 billion (about 9%), or about 7% net of stock issuances, which spiked in the second quarter. Yet single-digit payout growth trailed the 57% earnings jump, pulling the S&P 500 cash payout ratio (63.52% in Damodaran’s table) down to 63%, its lowest since 2004.
From balance sheets to private credit: the debt behind the buildout and the revenue hurdle by 2030
Financing $1.81 trillion in twelve-month capex has expanded corporate balance sheets. Between the second quarters of 2025 and 2026, book equity across all 5,376 US stocks rose almost 13% ($1.8 trillion) and book debt rose almost 8% ($1.9 trillion). In technology, book equity jumped almost 30% and debt climbed about 18.8%. Damodaran notes that public filings exclude private AI firms like Anthropic and OpenAI (expected to top $1 trillion in value). Filings also omit obligations in joint ventures and off-balance-sheet entities, understating total corporate debt.
In the abstract of an October 5 National Bureau of Economic Research working paper (NBER Working Paper 35865), Stijn Van Nieuwerburgh quantifies that off-balance-sheet shift. He estimates that a 1-gigawatt AI campus costs about $41 billion, and that a 188-gigawatt US buildout by 2032 requires nearly $9 trillion (3.2% of US GDP annually over 2025 through 2032). As hyperscaler capex outgrows internal cash flow, financing is shifting toward leases, joint ventures, project debt, private credit, securitization, and special-purpose vehicles. Those structures expand capacity but pile debt onto individual assets, obscure contingent obligations, and expose investors to tenant concentration, technological obsolescence, and uncertain residual values.
That shift toward private credit coincides with an upward revision to US corporate interest costs analyzed on October 9 by Matthew Klein in The Overshoot. Using 2023 tax data, the Bureau of Economic Analysis (BEA) revised up five-year domestic industry net interest payments by 86% ($532 billion annualized), lifting estimated US income by about 2%. Until August 26, the BEA had implausibly estimated negative corporate net interest in the second quarter of 2026. Klein notes that companies owe far more in debt than they hold in interest-bearing assets and have added debt faster than cash. Since the third quarter of 2022, the gap between nonfinancial corporations’ bond and loan liabilities and their bond and loan assets has stayed near $10.2 trillion. Much of the debt added since early 2022 consists of high-yielding floating-rate loans from private credit funds, hedge funds, and collateralized loan obligations (CLOs).
Rising borrowing costs do not hit all corporate investment plans equally. In an October 7 Liberty Street Economics study of Compustat data, Thomas Drechsel, Daniel Lewis, Davide Melcangi, and Laura Pilossoph found that most firms adjust capital stock growth little after rate surprises. For about 5% of firms and quarters, however, a surprise 1-percentage-point federal funds hike cuts capital growth by 4 percentage points. That sensitivity varies mainly within the same firm over time: small, young, and short-maturity borrowers cut investment most, whereas optimistic firms cut less.
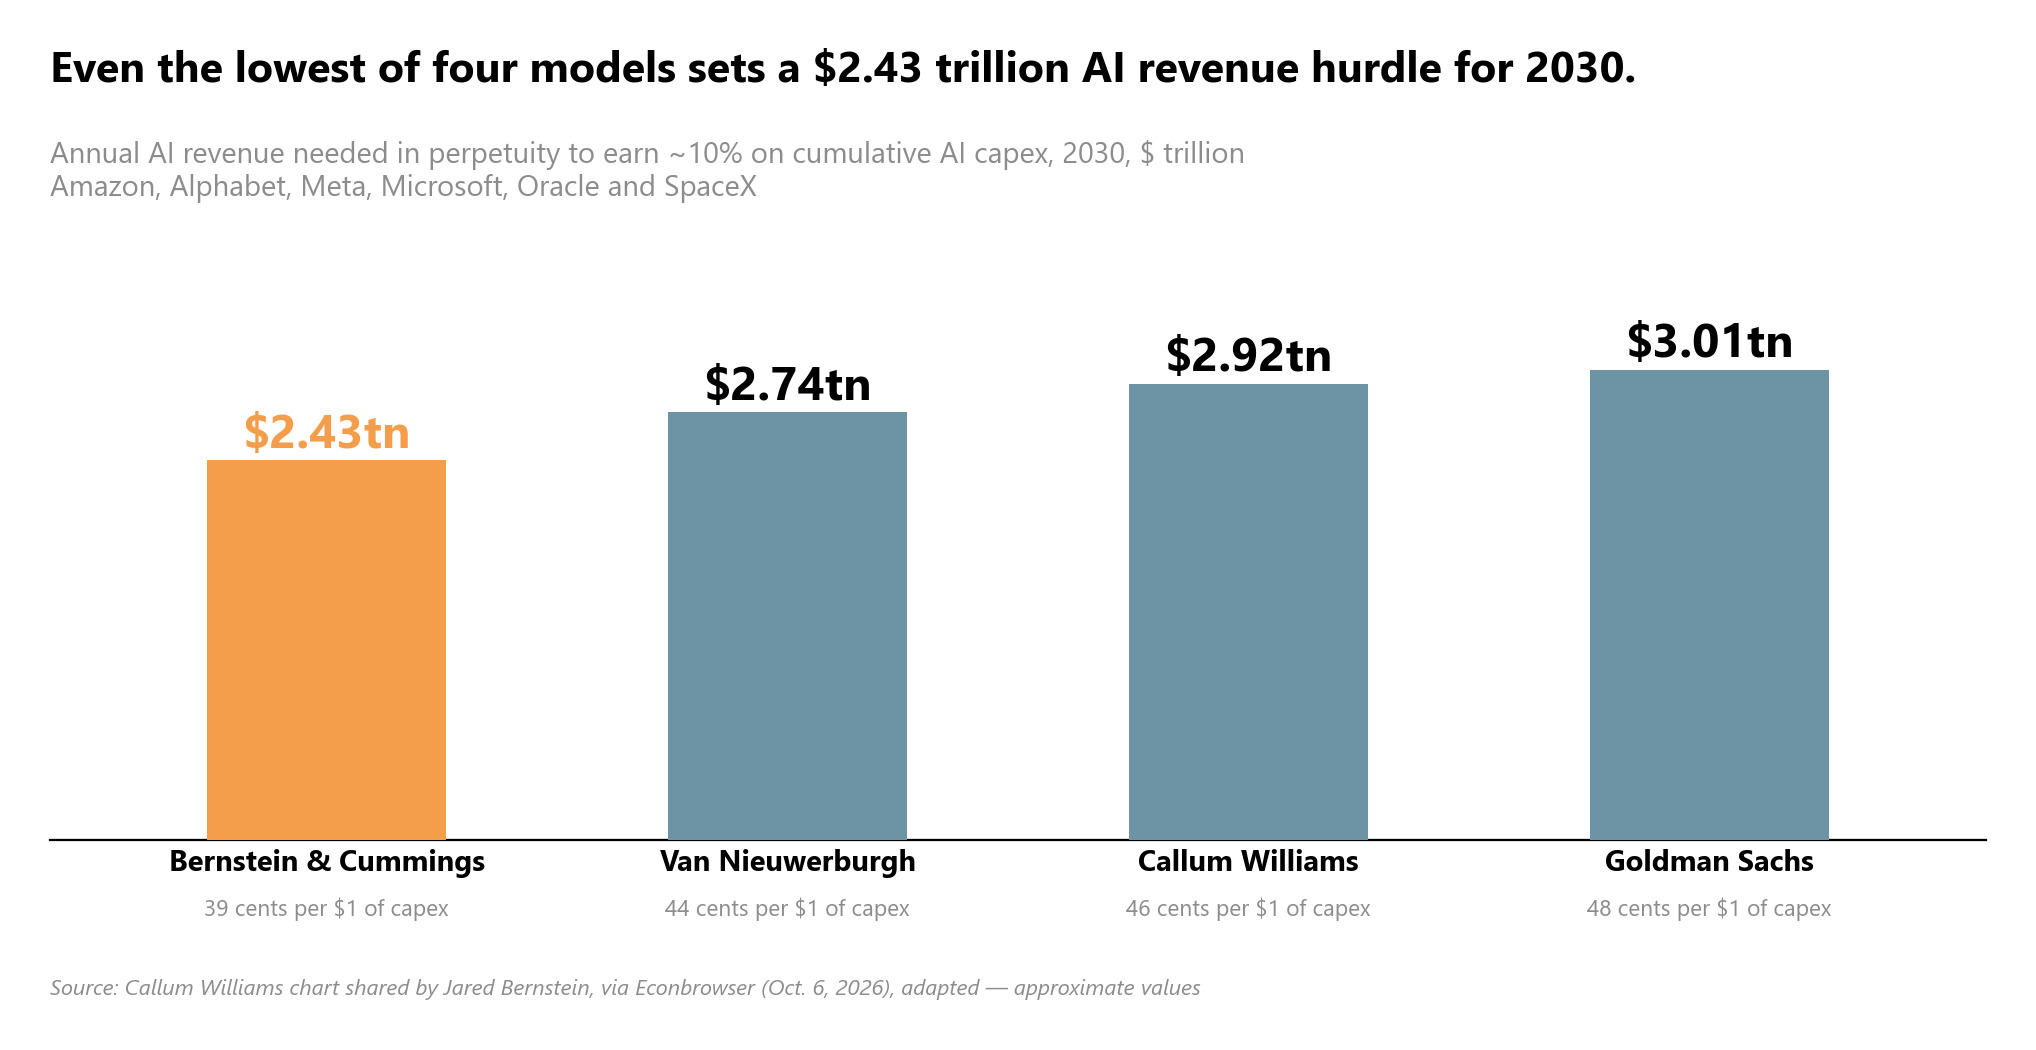
Across Amazon, Alphabet, Meta, Microsoft, Oracle, and SpaceX (which raised $75 billion in its June 12 IPO), corporate optimism faces a steep revenue test. On October 6, Econbrowser reproduced a Callum Williams chart shared by Jared Bernstein comparing four models of the annual AI revenue needed in perpetuity to earn roughly 10% on cumulative AI capex. By 2030, required annual AI revenue reaches $2.43 trillion under Bernstein & Cummings (39 cents per capex dollar) and $2.74 trillion under Van Nieuwerburgh’s 2026 Brookings model (44 cents). Williams’s model puts the 2030 target at $2.92 trillion (46 cents), and Goldman Sachs puts it at $3.01 trillion (48 cents).
Operating numbers from model labs show the distance to that target. In an October 7 Klement on Investing column, Joachim Klement cited Anthropic’s IPO prospectus, obtained by Reuters. Anthropic’s 2025 revenue rose nearly 12-fold to $4.6 billion against $7.3 billion in compute and infrastructure costs, widening its operating loss from $2.98 billion in 2024 to $8.06 billion in 2025. Private capital still backed the buildout in early October. According to Crunchbase News on October 9, weekly US venture deals were led by $2 billion for Flex spinout Axiom Solutions International ($37.5 billion initial enterprise value) and $870 million for TypeSafe AI ($7.5 billion valuation).
What it means
Damodaran maps the resolution of this cycle into two accounting outcomes for companies and their lenders. In his best-case scenario, AI builders generate enough incremental earnings to beat their cost of capital, repay lenders, and restore free cash flow, emerging as more capital-intensive businesses. In his worst-case scenario, AI investments fail to deliver promised profits, triggering large capex write-offs and stock markdowns as investors lose trust in management. Debt-dependent builders would face defaults and distress, inflicting losses on lenders.
For institutional and retail savers, Damodaran argues that sitting out the AI cycle is impossible. Because firms spend cash today and stock prices already bake in future payoffs, every investor chooses among four stances.
- Betting on an early AI victory by buying disruptors and shorting disrupted firms, without the excessive borrowing that sank Leo Aschenbrenner’s Situational Awareness.
- Riding the market consensus passively through an S&P 500 or US total market index fund.
- Positioning as a skeptic by steering new money into less exposed industries like food processing and leisure, or into European and Asian equities.
- Selling equities into cash and shorting AI winners outright, a trade that has punished short sellers for two years.
Passive index holders who assume they own a diversified slice of American business are already making an implicit bet on the upside scenario at a 3.70% equity risk premium. Until free cash flow catches up with net income, the S&P 500 at 7,800 prices supplier profits as permanent and builder capex as risk-free.
Sources
- Stock Prices, Earnings and Cashflows: The AI Effect plays through! (Aswath Damodaran)
- Chart: A look at the S&P 500’s remarkable and defiant trip to a new record (CNBC Finance)
- Financing the AI Buildout (NBER)
- Reconciling AI Expected Revenues to CapEx (Econbrowser)
- Found: America’s Missing Interest Income (The Overshoot)
- Firm Heterogeneity and the Response of Investment to Monetary Policy (Liberty Street Economics)
- Can AI labs ever turn a profit? (Klement on Investing)
- The Week’s 10 Biggest Funding Rounds: AI And Energy Top A Busy Lineup Of Large Rounds (Crunchbase News)
- Better Investment Right Now: Stocks or Bonds? (A Wealth of Common Sense)
- Lagarde Calls AI Financing ‘Serious Competition for Sovereign Debt’ (Count2Three)